Graph of Phoenix Housing Inventory
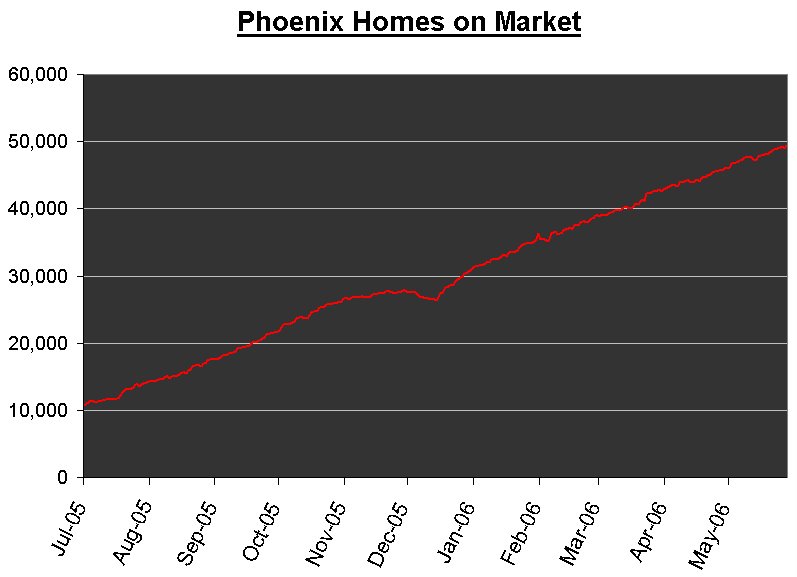
I wonder what happened in December and early January. The trend is amazingly linear, otherwise.
When do we start considering Phoenix a buyer's market? Now? When inventory hits 6oK? When the trend shows clear signs it has reversed? As I said in the comments to the previous housing inventory post, I think I want to start making lowball offers when I get back there!
![]()


No comments:
Post a Comment